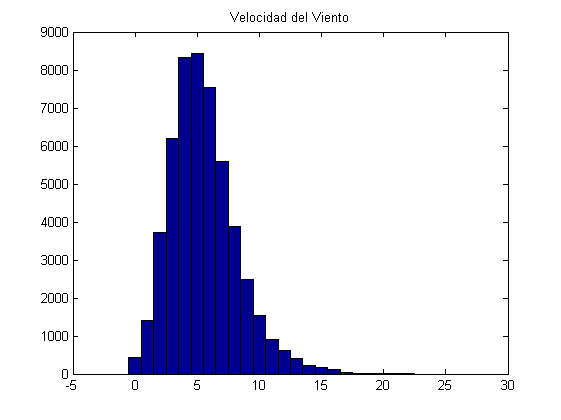
A)
a=xlsread('sotaventogaliciaanual.xlsx');
hist(a(:,1),0:25);
title('Velocidad del Viento');
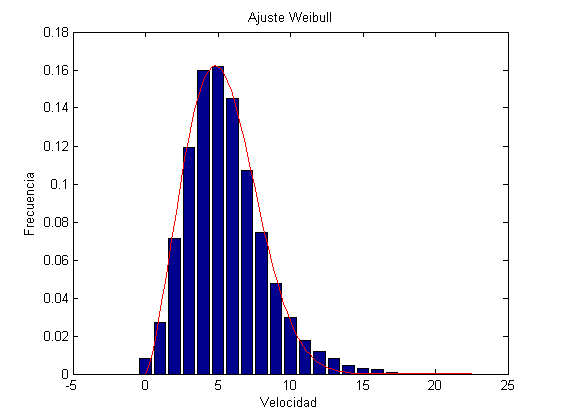
B)
media=mean(a);
de=std(a).^2;
x=0:1:max(a);
h=hist(a,x);
frec=h/sum(h);
f=@(b,x) (b(1)/b(2))*((x/b(2)).^(b(1)-1)).*exp(-(x/b(2)).^b(1));
b0=[media,de];
b=nlinfit(x,frec,f,b0);
bar(x,frec)
hold on
x=linspace(0,max(a),100);
y=f(b,x);
plot(x,y,'red')
xlabel('Velocidad'),ylabel('Frecuencia');
title('Ajuste Weibull')
hold off
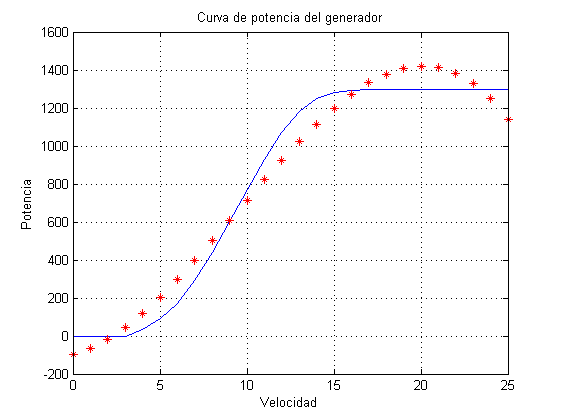
C)
p=xlsread('sotavento_curva_potencia.xlsx');
x=0:25;
plot(x,p(:,2))
grid on
xlabel('Velocidad'),ylabel('Potencia');
title('Curva de potencia del generador')
hold on
ajuste=polyfit(x,p(:,2)',3);
yajuste=polyval(ajuste,x);
plot(x,yajuste,'*r')
hold off